Multi-subject HTFA

htfa.HTFA fits hierarchical topographic factor analysis to several subjects at once. Each subject has its own TFA model (centers, widths and weights), and the subjects’ centers and widths are tied to a group template through Gaussian priors. The fit alternates between refitting each subject with the template as a prior (max_local_iter iterations of each subject’s TFA) and updating the template from the subjects’ estimates (a maximum a posteriori update), for at most max_global_iter
rounds. The subjects can have different numbers of voxels and time points; they only need the same coordinate dimensionality and the same K.
This tutorial uses synthetic 2D data (4 subjects, a 12 x 12 grid, 3 factors, 30 time points) so that the true template and the true subject-level factors are known.
The simulation isolates how a shared spatial template relates to individual estimates; it does not represent a particular experiment. For real data, subject coordinates must describe comparable spatial locations for the shared template to have that interpretation. Matching coordinate dimensionality alone does not register one brain to another. HTFA fitting itself does not require participants to view the same stimulus or have synchronized time courses; cross-subject time-course analyses impose additional alignment requirements.
[1]:
# Install htfa if it is missing (for example on Colab); other packages
# install themselves the first time they are needed.
try:
    import htfa  # noqa: F401
except ImportError:
    %pip install -q htfa
[2]:
import time
import warnings

import numpy as np

import htfa
from htfa.synthetic import match_factors

plt = htfa.require("matplotlib.pyplot")

K, n_sub, T = 3, 4, 30
Xs, Rs, truth = htfa.make_htfa_data(
    n_sub,
    grid_shape=(12, 12),
    n_samples=T,
    K=K,
    noise=0.1,
    center_jitter=1.0,
    width_jitter=0.05,
    random_state=0,
)
print("subjects:", len(Xs), "| data shapes:", [x.shape for x in Xs])
print("true template centers:\n", np.round(truth["global_centers"], 1))
print("true template widths:", np.round(truth["global_widths"], 1))
print("subject 0 true centers:\n", np.round(truth["centers"][0], 1))


def template_error(model):
    perm = match_factors(truth["global_centers"], model.global_centers_)
    c = np.linalg.norm(model.global_centers_[perm] - truth["global_centers"], axis=1)
    w = (
        np.abs(model.global_widths_[perm] - truth["global_widths"])
        / truth["global_widths"]
    )
    return perm, c, w
subjects: 4 | data shapes: [(144, 30), (144, 30), (144, 30), (144, 30)]
true template centers:
 [[1.2 8.3]
 [9.1 6.4]
 [9.3 8.3]]
true template widths: [2.3 1.4 0.9]
subject 0 true centers:
 [[1.3 5.9]
 [8.9 5.2]
 [8.6 7.7]]
1. A first fit
fit(Xs, Rs) takes a list of (V, T) arrays and a matching list of (V, D) coordinate arrays. (Through htfa.fit, a list of inputs is one subject per element.) max_global_iter defaults to 10 and max_local_iter to 10. The synthetic data are on the generating model’s scale, so standardize=False preserves that scale for parameter recovery.
[3]:
t0 = time.perf_counter()
with warnings.catch_warnings(record=True) as caught:
    warnings.simplefilter("always")
    model = htfa.HTFA(K=K, standardize=False, random_state=0).fit(Xs, Rs)
print(f"fit time: {time.perf_counter() - t0:.1f} s")
print("warnings:", sorted({w.category.__name__ for w in caught}))
print(
    "n_iter_:",
    model.n_iter_,
    "| converged_:",
    model.converged_,
    "| engine_:",
    model.engine_,
)
perm, c, w = template_error(model)
print("template center error per factor (grid units):", np.round(c, 2))
print("template relative width error per factor:", np.round(w, 3))
fit time: 0.3 s
warnings: []
n_iter_: 10 | converged_: True | engine_: numpy
template center error per factor (grid units): [0.74 0.8  0.48]
template relative width error per factor: [0.017 0.019 0.105]
The printed stopping reason and iteration count describe convergence. The matched template errors compare the fitted shared centers with the known generating template in grid units.
2. What the model holds
global_centers_(K, D)andglobal_widths_(K,): the template.global_centers_cov_(K, D, D)andglobal_widths_var_(K,): the posterior covariance of each template center and the posterior variance of each template width.centers_,widths_,weights_: lists with one entry per subject, shaped(K, D),(K,)and(K, T_s).
The per-subject factors are returned in template order: factor k of every subject belongs to template factor k. The check below compares, for each subject, the distance from its center k to the template center k with the distance to the nearest other template center.
[4]:
print("template widths:", np.round(model.global_widths_, 2))
print("posterior variance of the widths:", np.round(model.global_widths_var_, 3))
print("posterior covariance of center 0:\n", np.round(model.global_centers_cov_[0], 3))
print(
    "posterior std of the centers (sqrt of the largest eigenvalue):",
    np.round(
        [np.sqrt(np.linalg.eigvalsh(S).max()) for S in model.global_centers_cov_], 3
    ),
)

G = model.global_centers_
for s in range(n_sub):
    d = np.linalg.norm(
        model.centers_[s][:, None, :] - G[None, :, :], axis=2
    )  # (k, template)
    own = np.diag(d)
    other = np.where(np.eye(K, dtype=bool), np.inf, d).min(axis=1)
    print(
        f"subject {s}: distance to own template factor {np.round(own, 2)}; "
        f"to nearest other template factor {np.round(other, 2)}"
    )
print("weights shapes:", [w_.shape for w_ in model.weights_])
template widths: [1.04 2.3  1.43]
posterior variance of the widths: [0.581 0.581 0.581]
posterior covariance of center 0:
 [[0.141 0.   ]
 [0.    0.141]]
posterior std of the centers (sqrt of the largest eigenvalue): [0.375 0.375 0.375]
subject 0: distance to own template factor [0.63 1.91 1.17]; to nearest other template factor [2.11 8.15 2.65]
subject 1: distance to own template factor [1.17 1.08 1.25]; to nearest other template factor [1.71 7.89 2.2 ]
subject 2: distance to own template factor [1.03 0.9  0.71]; to nearest other template factor [1.32 9.19 1.42]
subject 3: distance to own template factor [1.14 0.62 0.58]; to nearest other template factor [3.03 9.05 2.12]
weights shapes: [(3, 30), (3, 30), (3, 30), (3, 30)]
The table compares each subject factor’s distance to its assigned template factor with its distance to other template factors. This illustrates spatial separation in this example. Factor correspondence uses joint matching, so an assigned template factor need not be the independently nearest one in every dataset.
3. Subject factors against the truth
The true subject-level centers are jittered copies of the true template (center_jitter). The table compares each subject’s estimated centers, matched to that subject’s true centers, with the template’s error.
[5]:
for s in range(n_sub):
    p = match_factors(truth["centers"][s], model.centers_[s])
    e = np.linalg.norm(model.centers_[s][p] - truth["centers"][s], axis=1)
    print(f"subject {s}: center error per factor {np.round(e, 2)}")
subject 0: center error per factor [0.01 0.03 0.  ]
subject 1: center error per factor [0.02 0.05 0.03]
subject 2: center error per factor [0.05 0.03 0.03]
subject 3: center error per factor [0.02 0.02 0.01]
The subject-level errors compare estimates with each subject’s own jittered centers. Template errors instead compare the shared center with the generating template. With a finite set of subjects, their mean center can differ from that generating template even when individual fits recover their own factors well.
4. max_global_iter and convergence
The template update stops on its parameter-change threshold or an objective/plateau rule, or when it reaches max_global_iter. Inspect converged_reason_ alongside converged_ and n_iter_. Reaching the iteration limit raises a ConvergenceWarning; convergence of this stopping rule does not establish a global optimum.
[6]:
for mg in [1, 3, 10, 25]:
    t0 = time.perf_counter()
    with warnings.catch_warnings(record=True) as caught:
        warnings.simplefilter("always")
        m = htfa.HTFA(K=K, max_global_iter=mg, standardize=False, random_state=0).fit(
            Xs, Rs
        )
    _, c, w = template_error(m)
    print(
        f"max_global_iter={mg:2d}: n_iter_={m.n_iter_:2d} "
        f"converged_={m.converged_!s:5} "
        f"max center err={c.max():.2f} max width err={w.max():.3f} "
        f"warnings={sorted({x.category.__name__ for x in caught})} "
        f"({time.perf_counter() - t0:.1f} s)"
    )
max_global_iter= 1: n_iter_= 1 converged_=False max center err=0.78 max width err=0.106 warnings=['ConvergenceWarning'] (0.2 s)
max_global_iter= 3: n_iter_= 3 converged_=False max center err=0.79 max width err=0.105 warnings=['ConvergenceWarning'] (0.2 s)
max_global_iter=10: n_iter_=10 converged_=True  max center err=0.80 max width err=0.105 warnings=[] (0.2 s)
max_global_iter=25: n_iter_=10 converged_=True  max center err=0.80 max width err=0.105 warnings=[] (0.2 s)
The printed rows compare the stopping reason, iteration count, and template errors for each iteration budget. A small budget can stop the fit before the threshold is reached. Elapsed time is diagnostic here; see the Performance page for controlled benchmarks.
5. Parallel subject fits
n_jobs runs the subject fits of each round in parallel with joblib (NumPy engines only). With the same random_state the result is the same as the serial fit.
[7]:
res_jobs = {}
for nj in [1, 2]:
    t0 = time.perf_counter()
    with warnings.catch_warnings():
        warnings.simplefilter("ignore")
        res_jobs[nj] = htfa.HTFA(K=K, n_jobs=nj, standardize=False, random_state=0).fit(
            Xs, Rs
        )
    print(f"n_jobs={nj}: {time.perf_counter() - t0:.1f} s")
diff = np.abs(res_jobs[1].global_centers_ - res_jobs[2].global_centers_).max()
print("max |template difference| between n_jobs=1 and n_jobs=2:", diff)
n_jobs=1: 0.3 s
n_jobs=2: 0.3 s
max |template difference| between n_jobs=1 and n_jobs=2: 0.0
With the same random seed, serial and parallel subject fitting produce the same template; the maximum difference checks this directly. The benefit of parallel fitting depends on the size of each subject fit and the overhead of starting workers. See the Performance page for controlled timing comparisons.
6. Different numbers of voxels and time points
The subjects below keep a random 70-100% of the voxels and between 20 and 30 time points. Each subject’s coordinates must match its rows.
[8]:
rng = np.random.default_rng(5)
Xs2, Rs2 = [], []
for X_, R_ in zip(Xs, Rs, strict=True):
    keep = np.sort(
        rng.choice(len(R_), size=int(len(R_) * rng.uniform(0.7, 1.0)), replace=False)
    )
    t_s = int(rng.integers(20, T + 1))
    Xs2.append(X_[keep][:, :t_s])
    Rs2.append(R_[keep])
print("shapes:", [x.shape for x in Xs2])

t0 = time.perf_counter()
with warnings.catch_warnings():
    warnings.simplefilter("ignore")
    m2 = htfa.HTFA(K=K, standardize=False, random_state=0).fit(Xs2, Rs2)
print(f"fit time: {time.perf_counter() - t0:.1f} s")
_, c, w = template_error(m2)
print("template center error per factor:", np.round(c, 2))
print("weights shapes:", [w_.shape for w_ in m2.weights_])
shapes: [(135, 22), (126, 22), (115, 29), (121, 22)]
fit time: 0.3 s
template center error per factor: [0.74 0.77 0.52]
weights shapes: [(3, 22), (3, 22), (3, 29), (3, 22)]
Each subject has its own voxel count and number of time points. The returned weights_ arrays retain those time counts; the table compares template accuracy with the equal-sized case.
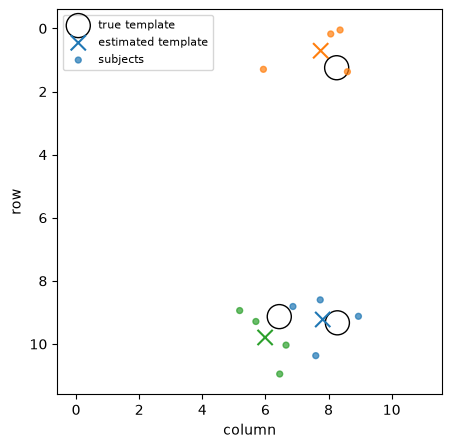
7. Template and subject factors in one picture
Circles mark true template centers, crosses the estimated template, and dots each subject’s estimated centers (all in grid units, in the template’s factor order).
[9]:
fig, ax = plt.subplots(figsize=(5, 5))
colors = plt.cm.tab10(np.arange(K))
true_c = truth["global_centers"]
ax.scatter(
    true_c[:, 1],
    true_c[:, 0],
    s=300,
    facecolors="none",
    edgecolors="k",
    label="true template",
)
ax.scatter(
    model.global_centers_[:, 1],
    model.global_centers_[:, 0],
    marker="x",
    s=120,
    c=colors,
    label="estimated template",
)
for s in range(n_sub):
    ax.scatter(
        model.centers_[s][:, 1],
        model.centers_[s][:, 0],
        c=colors,
        s=18,
        alpha=0.7,
        label="subjects" if s == 0 else None,
    )
# Include every estimated center, including those outside the sampled grid.
all_centers = np.vstack([true_c, model.global_centers_, *model.centers_])
lo = np.minimum(all_centers.min(axis=0), 0) - 0.6
hi = np.maximum(all_centers.max(axis=0), 11) + 0.6
ax.set_xlim(lo[1], hi[1])
ax.set_ylim(hi[0], lo[0])
ax.set_xlabel("column")
ax.set_ylabel("row")
ax.set_aspect("equal")
ax.legend(fontsize=8)
plt.show()