Note
Go to the end to download the full example code.
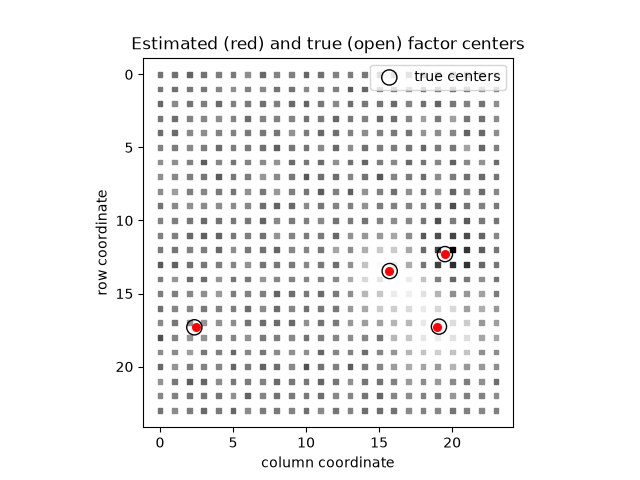
Factor centers of a single-subject TFA
Simulate a 24 x 24 grid with K = 4 radial basis factors
(htfa.make_tfa_data()), fit it with htfa.fit() and draw the estimated
factor centers on top of the data with htfa.HTFAResults.plot_nodes().
The data are fitted on their generating scale with standardize=False so
that the estimated parameters can be compared with the known simulation values.
The printed numbers (fit time, convergence reason, center errors) come from the
code below.
data: 576 locations x 40 samples
fit time: 0.2 s, stopped because: threshold
center error per factor (grid units): [0.013 0.022 0.013 0.021]
import time

import matplotlib.pyplot as plt
import numpy as np

import htfa
from htfa.synthetic import match_factors

X, R, truth = htfa.make_tfa_data((24, 24), n_samples=40, K=4, random_state=0)

start = time.perf_counter()
res = htfa.fit(X, K=4, coords=R, standardize=False, random_state=0)
elapsed = time.perf_counter() - start

perm = match_factors(truth["centers"], res.centers[0])
errors = np.linalg.norm(res.centers[0][perm] - truth["centers"], axis=1)
print(f"data: {X.shape[0]} locations x {X.shape[1]} samples")
print(f"fit time: {elapsed:.1f} s, stopped because: {res.model.converged_reason_}")
print("center error per factor (grid units):", np.round(errors, 3))

fig = res.plot_nodes(subject=0)
ax = fig.axes[0]
ax.scatter(
    truth["centers"][:, 1],
    truth["centers"][:, 0],
    facecolors="none",
    edgecolors="k",
    s=120,
    label="true centers",
)
ax.set_title("Estimated (red) and true (open) factor centers")
ax.set_xlabel("column coordinate")
ax.set_ylabel("row coordinate")
ax.legend(loc="upper right")
plt.show()
Total running time of the script: (0 minutes 0.242 seconds)